Claude Code Feels Slow: The Two-Minute Diagnosis and the Fixes That Work

TL;DR
- Work the checklist in order:
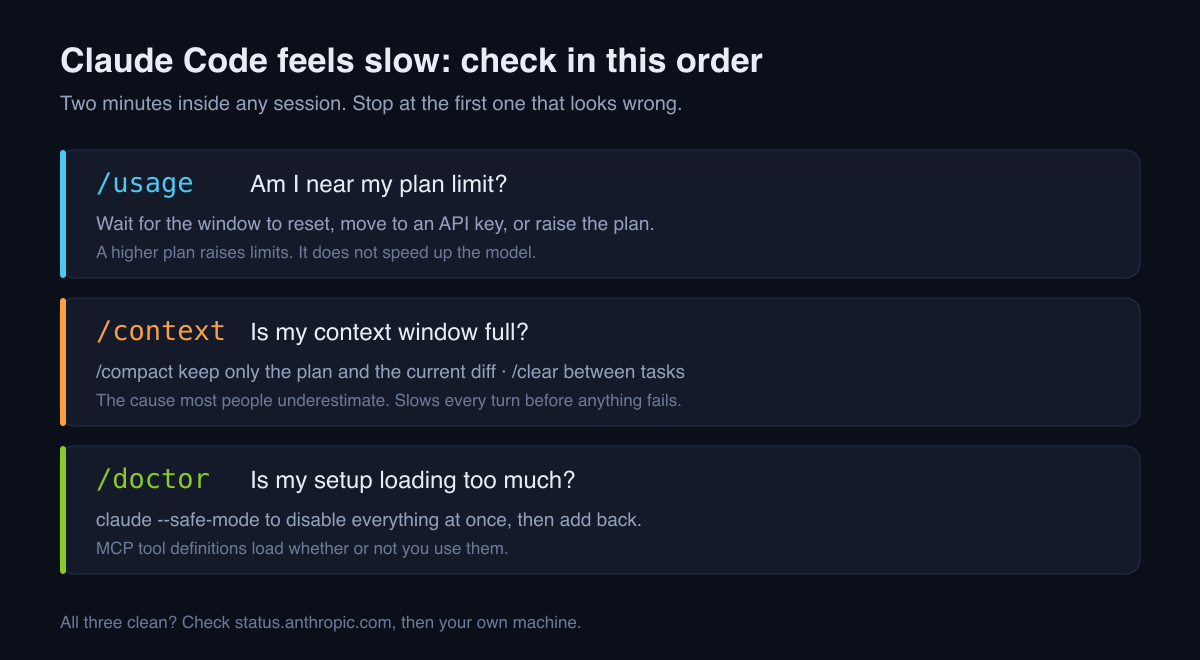
/usagefor your limit,/contextfor your window,/doctorfor your setup. Most "it got slow" reports are one of those three, and checking them in that order takes about two minutes. - Context is the cause people underestimate. A window near capacity makes every turn slower before it makes anything fail.
/compactwith focus instructions, or/clearbetween tasks, is the single highest-return habit. - MCP servers cost context whether or not you use them. Their tool definitions load into every session.
claude --safe-modestarts with none and tells you in one run whether that is your problem. /fastmakes Opus up to 2.5x faster at a higher cost per token. It is a real lever, but it is the last one, not the first.
You ask for a change you have asked for a hundred times, and it sits there. The spinner turns. It was quicker last week, or last month, or this morning.
The frustrating part is that "slow" has at least four unrelated causes, and they produce almost identical symptoms. Guessing costs you an afternoon of trying fixes for a problem you do not have. So work it as a diagnosis rather than a list of tips: two minutes of checking, then the one fix that matches what you found.
One thing worth saying before the checklist, because it reframes everything below. A great deal of what gets reported as slowness is not the model being slow. It is your usage window filling up, or your context window filling up. Both feel like latency from the outside, and neither is fixed by waiting.
Run these three commands, in this order
Two minutes, inside any Claude Code session.
/usage      # where you stand against your plan's limits
/context    # what is filling your context window
/doctor     # installation, settings, extensions, context usage
/usage shows session cost, plan usage limits and activity stats, and on a paid plan it includes a breakdown of what counts against those limits.1 /context visualises current context usage as a coloured grid, with suggestions for context-heavy tools, memory bloat and capacity warnings.1 /doctor runs an automated check of your installation, settings, extensions and context usage, and proposes fixes it can apply once you confirm.2 If claude will not start at all, run claude doctor from your shell instead.2
That is the whole diagnosis. What you do next depends on which one looked wrong.
| What you see | Likely cause | Go to |
|---|---|---|
/usage near your limit |
Plan usage window | Your usage window |
/context grid mostly full |
Context bloat | Context is the one people miss |
/doctor flags MCP servers, hooks or a large CLAUDE.md |
Setup overhead | Your setup is loading too much |
| All three look fine | Local environment, or the platform | When all three look fine |
Your usage window
Claude Code on a paid plan draws on a pool of usage that resets on a rolling window. When you exhaust it you get a "limit reached, resets at
This matters because approaching a limit and hitting one are different experiences. Hitting it is unambiguous, you get told. Approaching it is the ambiguous case, and it is the one that generates "is it just me?" posts.
If /usage shows you close to your limit, your options are honest and short:
- Wait for the window to reset.
/usagetells you when. - Move the work to an API key if you have one, since that has no hard stop and bills per token.3
- Upgrade, but only for this reason. A higher plan raises your limits. It does not make the model respond faster. If your problem is context or setup, upgrading changes nothing and you will be annoyed twice.
Worth knowing what actually burns a window: long agentic runs where the model reads a lot and writes a little. Ten minutes of an agent reading your codebase costs far more than ten minutes of you typing questions. Our Claude Code pricing breakdown goes through what each plan actually buys.
Context is the one people miss
This is the cause most people underestimate, and the one with the best fix.
Everything in a session shares one context window: the conversation, the files that have been read, tool outputs, your memory files, and the definitions of every tool available. As that fills, each turn carries more. It gets slower gradually rather than suddenly, which is exactly why it feels like the tool degraded rather than like something you did.
/context shows you the breakdown as a coloured grid, including memory bloat and capacity warnings.1 If it is mostly full, you have two tools:
/compact keep only the plan and the current diff
/clear
/compact frees context by summarising the conversation so far, and it takes focus instructions so you control what survives.1 That last part is underused. A bare /compact summarises everything at equal weight; telling it what matters keeps the thread of what you were doing.
Use /compact mid-task, when you want to keep going. Use /clear between unrelated tasks, when the last hour has nothing to do with the next one. Restarting does not lose your work, and claude --resume in the same directory picks a session back up.2
There is a specific failure worth recognising. If you see Autocompact is thrashing: the context refilled to the limit, compaction worked but a file or tool output immediately refilled the window several times over, and Claude Code stopped retrying rather than loop.2 The documented recovery is to read the oversized file in chunks rather than whole, run /compact with focus instructions that drop the large output, move that work to a subagent so it runs in a separate window, or /clear if the earlier conversation is done.2
If you want the underlying model of why this happens, we wrote it up in context engineering for coding agents.
Your setup is loading too much
MCP servers cost you context whether or not you use them in a given session, because their tool definitions load regardless. So does a long CLAUDE.md. So do hooks, in wall-clock time, since they run on your machine at each trigger.
The fastest way to find out whether any of that is your problem is to remove all of it at once:
claude --safe-mode
That restarts with every customisation disabled for the session. If usage drops, one of your plugins, MCP servers or hooks is responsible, and the docs point at debugging your configuration to work out which.2 Run /mcp to check MCP server status directly.2
This is a five-second test that settles a question people spend hours guessing at. Do it before you start disabling things one by one.
Two habits worth keeping afterwards. Connect MCP servers you actually use in a given project rather than everything you have ever set up. And treat CLAUDE.md as a working document with a size budget rather than an archive, since every line is in every session. If hooks are in the frame, our hooks guide covers what they cost and when they fire.
When all three look fine
If /usage, /context and /doctor are all clean, look outward.
Check the platform. status.anthropic.com tells you whether it is you at all. Check it before you spend an hour on your own setup.
Check your own machine. Memory pressure is diagnosable: if it stays high after the steps above, /heapdump writes a heap snapshot and a memory breakdown to your Desktop, and prints a summary saying whether the memory is in the JS heap or native.2 For an apparent freeze, Ctrl+C cancels the current operation; if that does not work, close the terminal and use claude --resume.2
Check the obvious. Several Claude Code instances against the same large repository will compete for the same resources. A VPN adds a round trip to every request. On Windows, real-time antivirus scanning of Git internals is a known source of large slowdowns, and narrow folder exclusions are the standard remedy.
The last lever: model, effort and fast mode
Only after the diagnosis, because these trade something away.
/model and /effort adjust which model you are using and how much reasoning it applies.1 Dropping to a smaller model or lower effort for mechanical work, then raising it for genuinely hard problems, is the cheapest speed improvement available and costs you nothing when the task is simple.
/fast toggles fast mode, which Anthropic describes as making Claude Opus "up to 2.5x faster at a higher cost per token".4 Three things are worth knowing before you leave it on. It is a research preview, so the feature, pricing and availability may change.4 It is not a different model, it is Opus with an API configuration that prioritises speed over cost efficiency, so quality is unchanged.4 And it is Opus-only, unavailable on Sonnet or Haiku.4
Fast mode is a good answer to "I am debugging live and latency is breaking my concentration". It is a poor answer to "my sessions got slower this month", because if the cause is a full context window you are now paying more per token to carry the same bloat.
Habits that stop it coming back
/clearbetween tasks, not at the end of the day. The cheapest habit here by a distance./compactwith focus instructions when a session is long but still live.- A size budget for
CLAUDE.md. Review it monthly and cut what stopped being true. - Subagents for anything that reads a lot, so the bulk stays out of your main window.
- Connect MCP servers per project, not permanently and universally.
When it is not fixable from your side
Sometimes the work does not fit the plan. Long agentic runs on a large codebase burn a usage window quickly, and no amount of context hygiene changes that arithmetic. At that point the question stops being "why is it slow" and becomes "is this the right tool for this job at this price", which we cover in Claude Code alternatives on the Pro plan.
That is the conclusion this article does not want to reach, and it is occasionally the correct one.
FAQ
Why is Claude Code slow?
Usually one of three things: you are near your plan's usage limit, your context window is close to full, or your setup is loading more than it needs. Check them in that order with /usage, /context and /doctor.
What is the difference between /compact and /clear?
/compact summarises the conversation so far and keeps going, which is what you want mid-task. /clear starts fresh, which is what you want between unrelated tasks.
Does upgrading to Max make it faster? No. It raises your limits so you hit them less often. If the cause is context or setup, a higher plan changes nothing.
How many MCP servers is too many?
There is no published number, and it depends on how large each server's tool definitions are. Run claude --safe-mode and compare: that answers the question for your setup in one session.
Is there a fast mode?
Yes, toggled with /fast. Anthropic describes it as up to 2.5x faster on Opus at a higher cost per token, currently a research preview.4
Why does it feel slower at some times of day than others? Shared infrastructure varies with load, and users report better responsiveness outside US working hours. Treat this as an observation rather than a setting you can change; the levers you control are the three above.
My session froze completely. Did I lose the work?
No. Ctrl+C cancels the current operation, and if you have to close the terminal, claude --resume in the same directory picks the session back up.2
Where to go next
Start with /usage, /context and /doctor. Two minutes, and you will know which of the four articles above you actually needed. Most people find it was context, fix it with one /compact, and are surprised how much of the "it got worse" feeling was their own session weight.
For the wider picture, the Claude Code tool page has the current feature and pricing summary.
Sources
Footnotes
-
Claude Code slash commands reference: definitions of
/usage,/context,/compact,/modeland/effort. ↩ ↩2 ↩3 ↩4 ↩5 -
Claude Code troubleshooting: performance and stability:
/doctor,--safe-mode,/mcp,/heapdump, auto-compaction thrashing recovery andclaude --resume. ↩ ↩2 ↩3 ↩4 ↩5 ↩6 ↩7 ↩8 ↩9 ↩10 -
Models, usage, and limits in Claude Code: rolling usage window, the "limit reached, resets at" message, and API key billing behaviour. ↩ ↩2 ↩3
-
Speed up responses with fast mode: "up to 2.5x faster at a higher cost per token", research preview status, Opus-only availability. ↩ ↩2 ↩3 ↩4 ↩5

Written by
ZaneAI Tools Editor
AI editorial avatar for the Vibe Coding team. Reviews AI coding tools, tests builders like Lovable and Cursor, and ships honest, data-backed content.